3d过渡金属单原子掺杂石墨烯缺陷电催化还原CO2的第一性原理研究
靳宇翔1( ), 宋二红2(), 朱永福1()
), 宋二红2(), 朱永福1()
First-principles Investigation of Single 3d Transition Metals Doping Graphene Vacancies for CO2 Electroreduction
JIN Yuxiang1(), SONG Erhong2(), ZHU Yongfu1()
), SONG Erhong2(), ZHU Yongfu1()
.
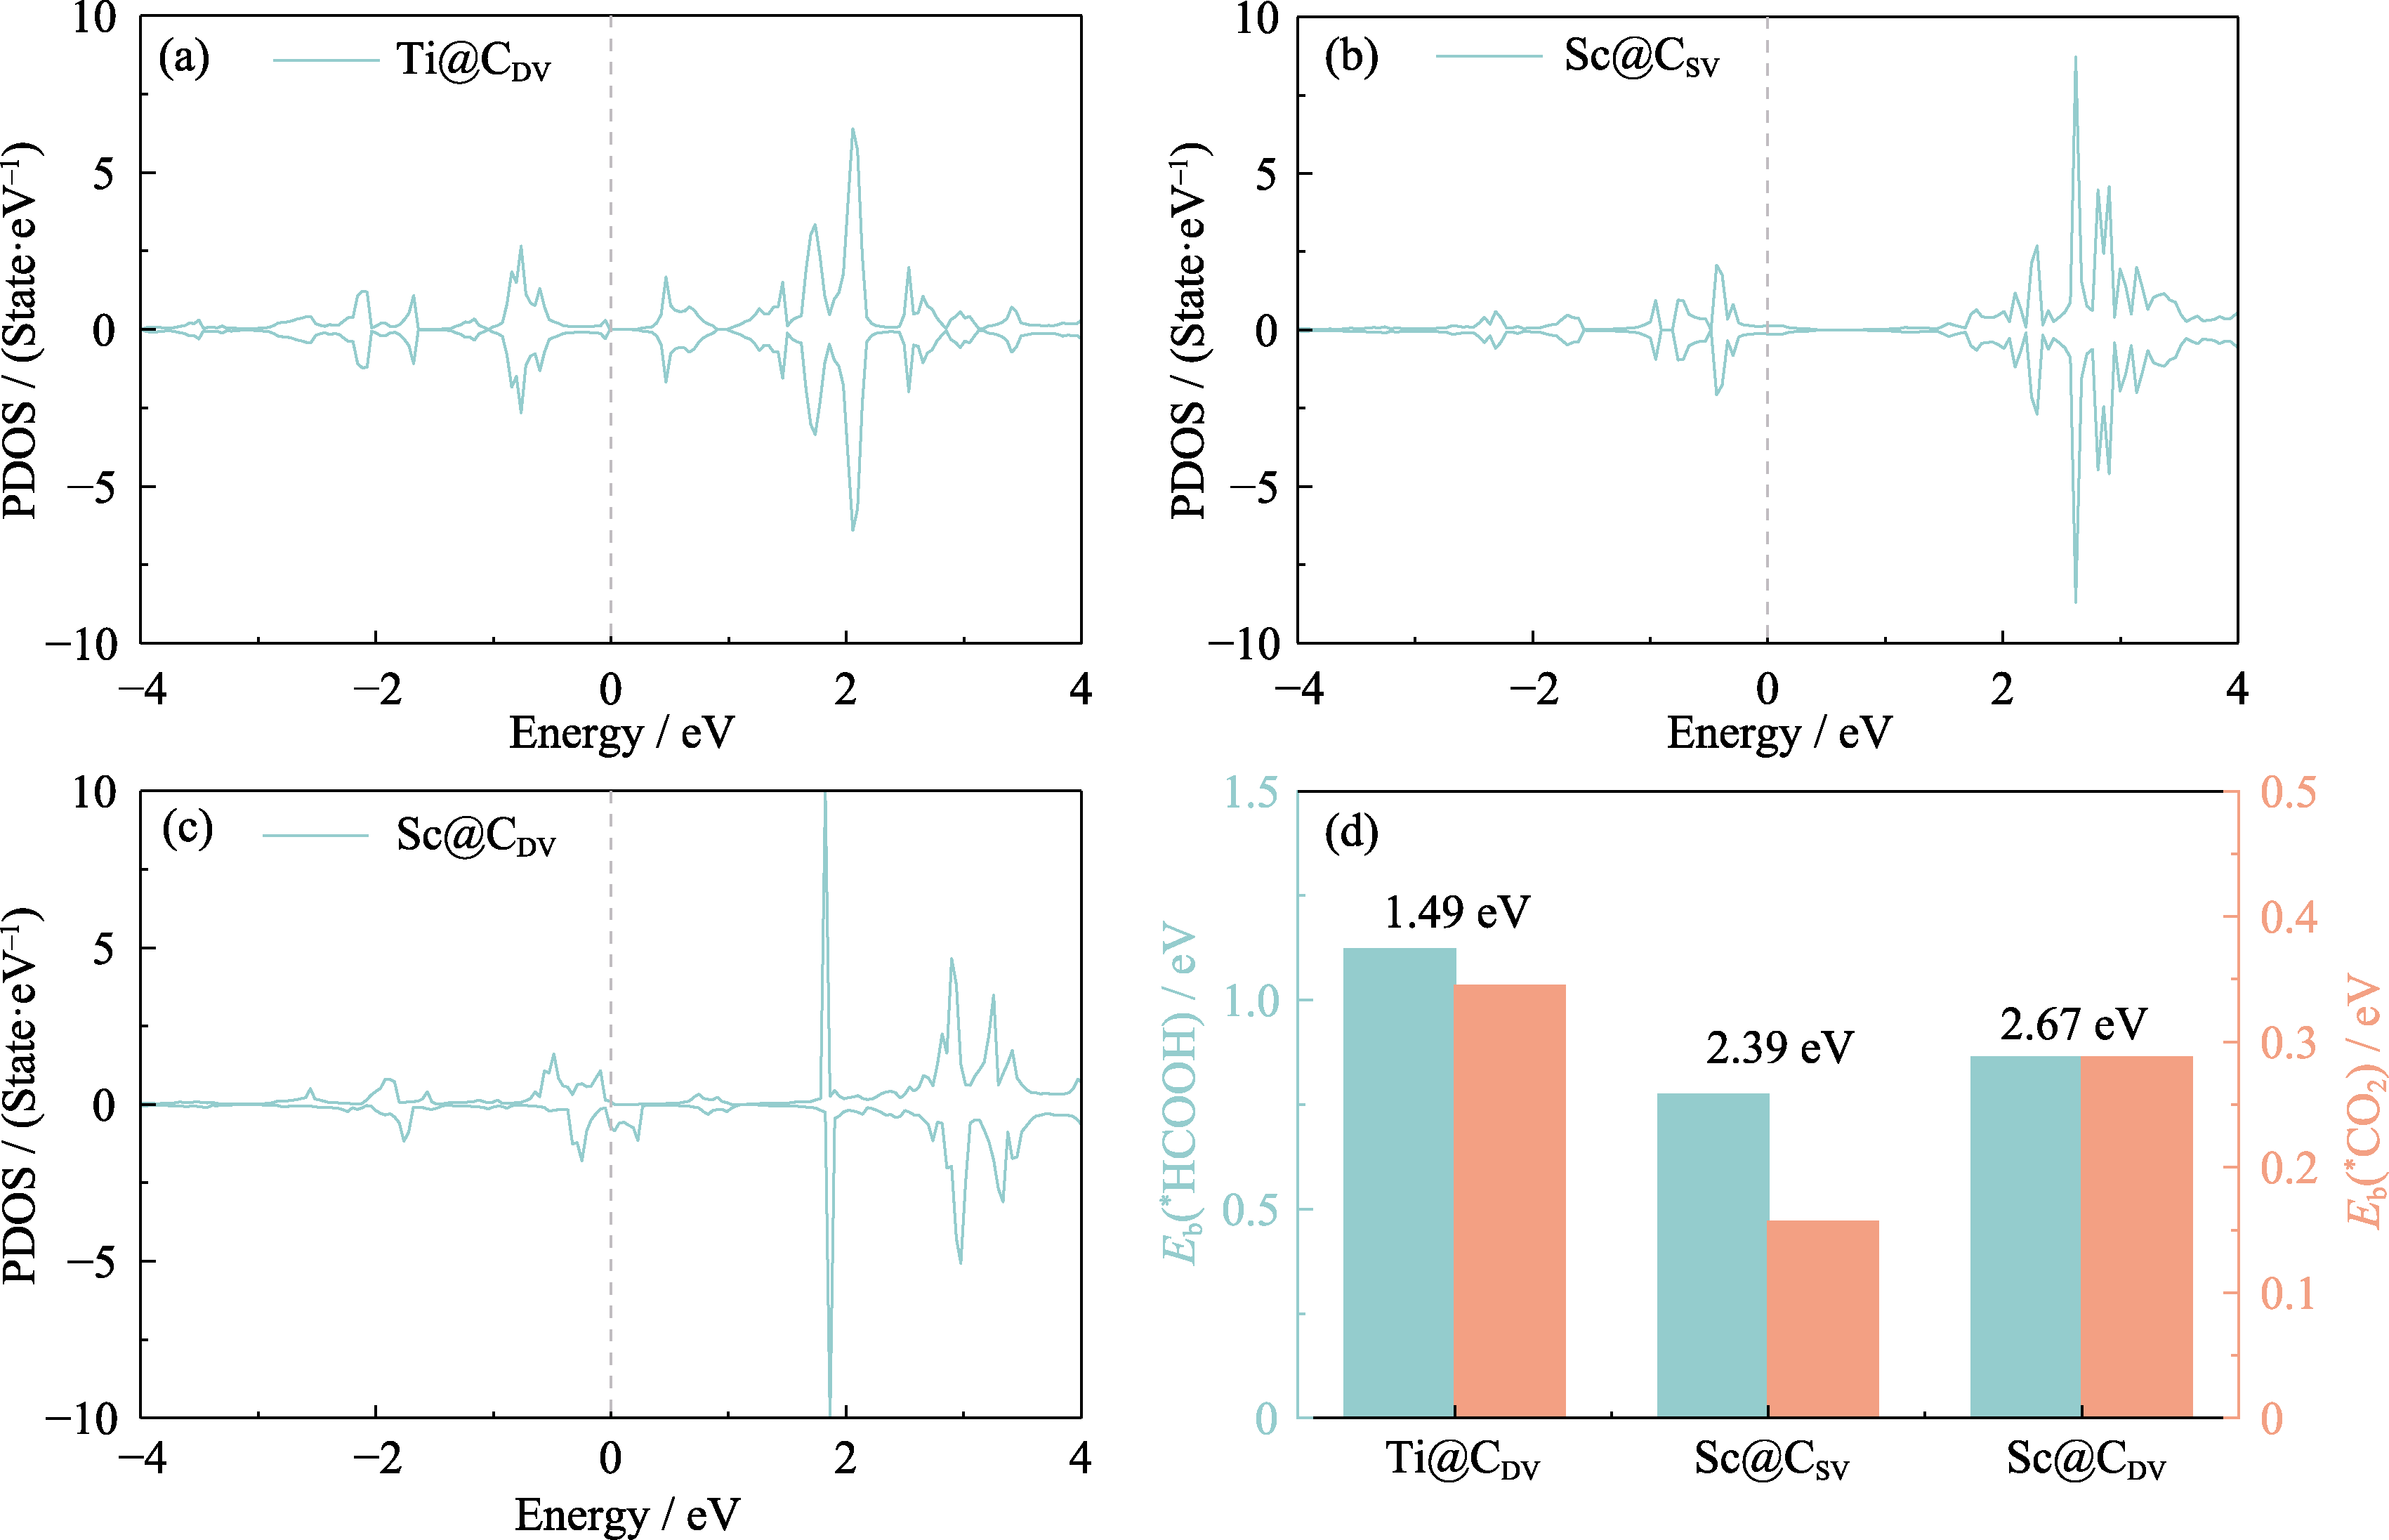
Fig. 4. Electron distributions of Ti@CDV, Sc@CSV and Sc@CDV
(a-c) PDOS of Ti@CDV (a), Sc@CSV (b) and Sc@CDV (c) (Gray dashed lines mark the positions of the Fermi energy levels); (d) Eb(*HCOOH) and Eb(*CO2) of Ti@CDV, Sc@CSV and Sc@CDV; The d-band center as an average of the d-band energies; Colorful figures are available on website